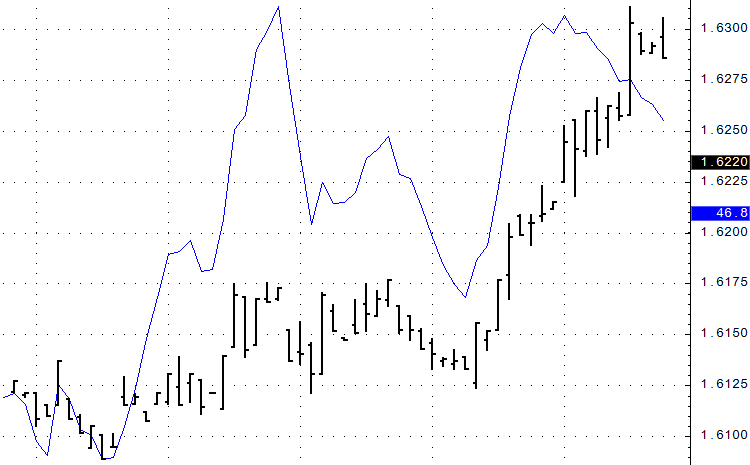
This indicator is used to determine the current strength of the market.
It is best used when the market is making a new high or new low. Look for divergence between price and TSI. If price is making a new high and the TSI is not, then the market is weak and may sell off. If price is making a new low and TSI is not, then the market is strong and may rally.
Line color and thickness can be changed in parameters.
Trend Strength Indicator Parameters
|
Parameter |
Description |
|
Display |
Opens sub-window to set parameters: •Color = Line color. •Weight = Line thickness. |